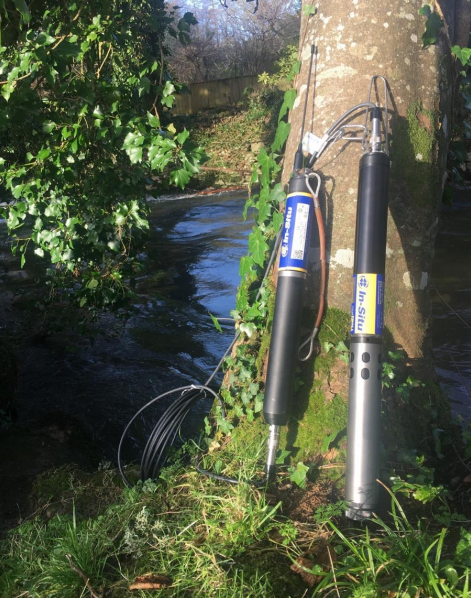
During January, a remarkable piece of equipment was installed on the River Yealm: the “Yealm sonde” , a continuous water monitor that automatically measures and transmits information about water quality from it’s location in the river .
 Why do we need a continuous water monitor?
It was purchased by the River Yealm Water Quality Group using funds raised from five local Parish Councils (Newton and Noss, Wembury, Brixton, Yealmpton and Sparkwell) plus one anonymous sponsor. This reflects a growing realisation within our community that we need to better understand and act upon the declining ecological health of our river. Water quality not only affects plants and wildlife, but also our river’s amenity and recreational values, together with shellfish farming. Measures of water quality from the “Yealm sonde” will complement the data on water quality being gathered by volunteers for our local Citizen Science Investigation (CSI), coordinated by the Yealm Estuary to Moor (YEM) project on behalf of the Westcountry Rivers Trust (WRT) . As part of that CSI, water quality measurements made at more than 25 locations along the River Yealm on a monthly basis help to identify and locate persistent pollution problems. However, monthly sampling is likely to miss intermittent pollution events such as raw sewage spills from storm overflows and land runoff upon heavy rainfall.
Our “Yealm sonde” transmits water quality data measured every 15 minutes via the mobile phone network to designated computers and phones. Data are logged as a record for associated reports of pollution, and alerts have been set to notify our CSI response team of transient pollution events. Those alerts will help us to locate the source of contamination, and collect associated evidence. Responding to an alert from the “Yealm sonde” may involve taking water samples to measure the standard WRT CSI endpoints, with additional options to measure concentrations of the intestinal bacterium Escherichia coli, as a standard marker of faecal pollution. We also have the equipment and training to enable further analyses that include for hydrocarbons, pesticides, metals and minerals.
These continuous measures by our sonde will also provide a ‘baseline’ of data that defines the characteristic chemistry and physics of River Yealm in more detail than has previously been possible. As such, automated monitoring will not only help us to assist more effectively in the reporting of pollution incidents to the relevant authorities, but will allow us to quantify the results of steps taken to improve the quality of the water. For example, nature-based solutions such as planting buffer zones may help to reduce the amount of run-off and associated pollutants that enter the river directly during periods of heavy rain.
The sonde was deployed on 13th January 2023. Looking here at the first two weeks of ensuing data, as we get to know our river, we have already seen a few noticeable responses. Three days after it’s deployment saw some heavy rainfall events, with the river depth rising from about 0.6 to 1.7 metres on 14th January, before falling back and rising again to about 1.5 metres on 16th January (Figure 1). Those peaks in river height were accompanied by dramatic rises in turbidity to values in excess of 300 NTU (nephelometric turbidity units) (Figure 2), associated with run-off from vulnerable land sites. These measures exceeded the maximum of 240 NTU able to be recorded using turbidity tubes by our CSI volunteers.
Over those same three days, the two peaks in river flow as reflected by river height were associated with marked reductions in total dissolved solids (TDS) (Figure 3) and pH (a measure of acidity/alkalinity) (Figure 4). TDS is a measure of the combined inorganic and organic substances dissolved in water, a measure which is usually elevated by harmful pollution from sources such as sewage, slurry and factory discharge. During this period the pH of the water remained well within the normal range (pH 6 to 9) for fish survival.
Again during those first three days, the peaks in river height were accompanied with a fall in water temperature from about 10 to 6.6 0C (Figure 5). Throughout, daily changes were evident in water temperature, reflecting colder nights up on Dartmoor where the river originates. Each of these changes in water temperature were associated with reductions in total dissolved oxygen (mg/l) (Figure 6) . This reflects how as water cools it is able to hold more oxygen, whilst microbial activity and associated oxygen consumption decrease.
The last few days of data from this 2 week period show peaks in turbidity on 25th and 27th January, both in the early hours of morning, one of which appears to be associated with a video recording of kaolin-like material in the river. We can also see significant peaks of total dissolved solids (TDS) on 25th and 26th January. These occurred during the hours of darkness, source unknown. None of these peaks in either turbidity or TDS were associated with rainfall, as there had been none for more than 10 days. YEM website provides a “live” feed of the data Preliminary data reported here illustrate our new ability to detect and therefore respond to pollution events alerted in real time. Now that we have all technical elements in place, and are comfortable with our sonde’s calibration plus associated alerts, we have shared a ‘live’ feed of the data on our YEM website. This now means that communities along the Yealm catchment can engage with their river by seeing and exploring findings for themselves.
Meanwhile, please do bear in mind that you can help us to interpret the measured indicators of pollution as recorded by our new sonde by forwarding photographs or video of any serious pollution you witness on the river to This email address is being protected from spambots. You need JavaScript enabled to view it..